Design swift, smart human resource analytics
with HRLYTIC’s instant HR data models!
Transform your HR system with HRLYTIC’s adaptable data models, ensuring a flawless fit into your existing framework for a dynamic HR infrastructure.
Enjoy a harmonious blend of HRLYTIC’s models with your HR systems.
Integrate diverse HR data effortlessly, creating a unified analytical approach.
Our models are crafted for adaptability, ensuring they grow with your company’s needs.
With HRLYTIC’s intuitive data models, streamline your HR processes, dedicating more time to strategy and human insights than ever before.
Navigate the complexities of HR with user-friendly data models.
Allocate more resources to strategic development
with simplified analytics.
HRLYTIC provides a modern approach to HR strategy, built for efficiency and insight.
Discover the narrative within your HR data, using HRLYTIC to identify trends and make predictions that drive your business forward with confidence.
Spot vital trends to inform successful HR strategies.
Utilize advanced HR data models to forecast and plan for the future.
Turn analytics into actionable progress, propelling your business.

Making Informed Decisions Supported by HR Data.

Merge and manage your HR data with unparalleled ease, creating a central hub for all your analytics needs with HRLYTIC.
Establish a single, authoritative source for all HR insights.
Leverage data to build strategies that resonate with your HR goals.
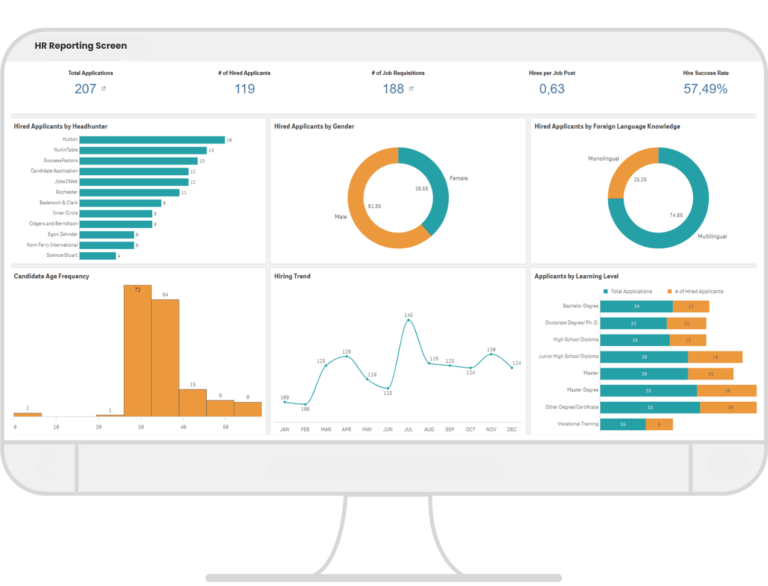
Visualize HR impact instantly with clear, intuitive dashboards.
Project and optimize future employee performance, and tailor development plans with insights gleaned from our comprehensive employee performance predictions.
Anticipate and prepare for future performance trends.
Leverage forecasts to inform your talent development strategies.
Dive into the underlying causes of employee turnover and craft targeted retention strategies, informed by our deep turnover and retention analytics.
Uncover the factors driving turnover to implement
effective retention strategies.
Utilize analytics to maintain high morale and retain your valued employees.

In the invitation window, you can type in several email addresses, so in most cases, you can invite your whole recruiting team in just one sweep.
HRLYTIC offers a flexible integration framework that allows it to connect to a variety of HR systems, including HRIS systems, employee engagement platforms, and performance management systems.
· Employee engagement
· Employee retention
· Employee productivity
· Workforce diversity
· Compensation and benefits
· Talent acquisition
HRLYTIC offers a variety of pricing plans to meet the needs of organizations of all sizes. For more information on pricing, please contact us.
HRLYTIC offers a variety of support options, including email, and live chat support. HRLYTIC also offers a knowledge base with articles on how to use the platform.
Yes, you are free share HR data reports with other people in your organization. HRLYTIC allows you to grant users different levels of access to your data and reports.