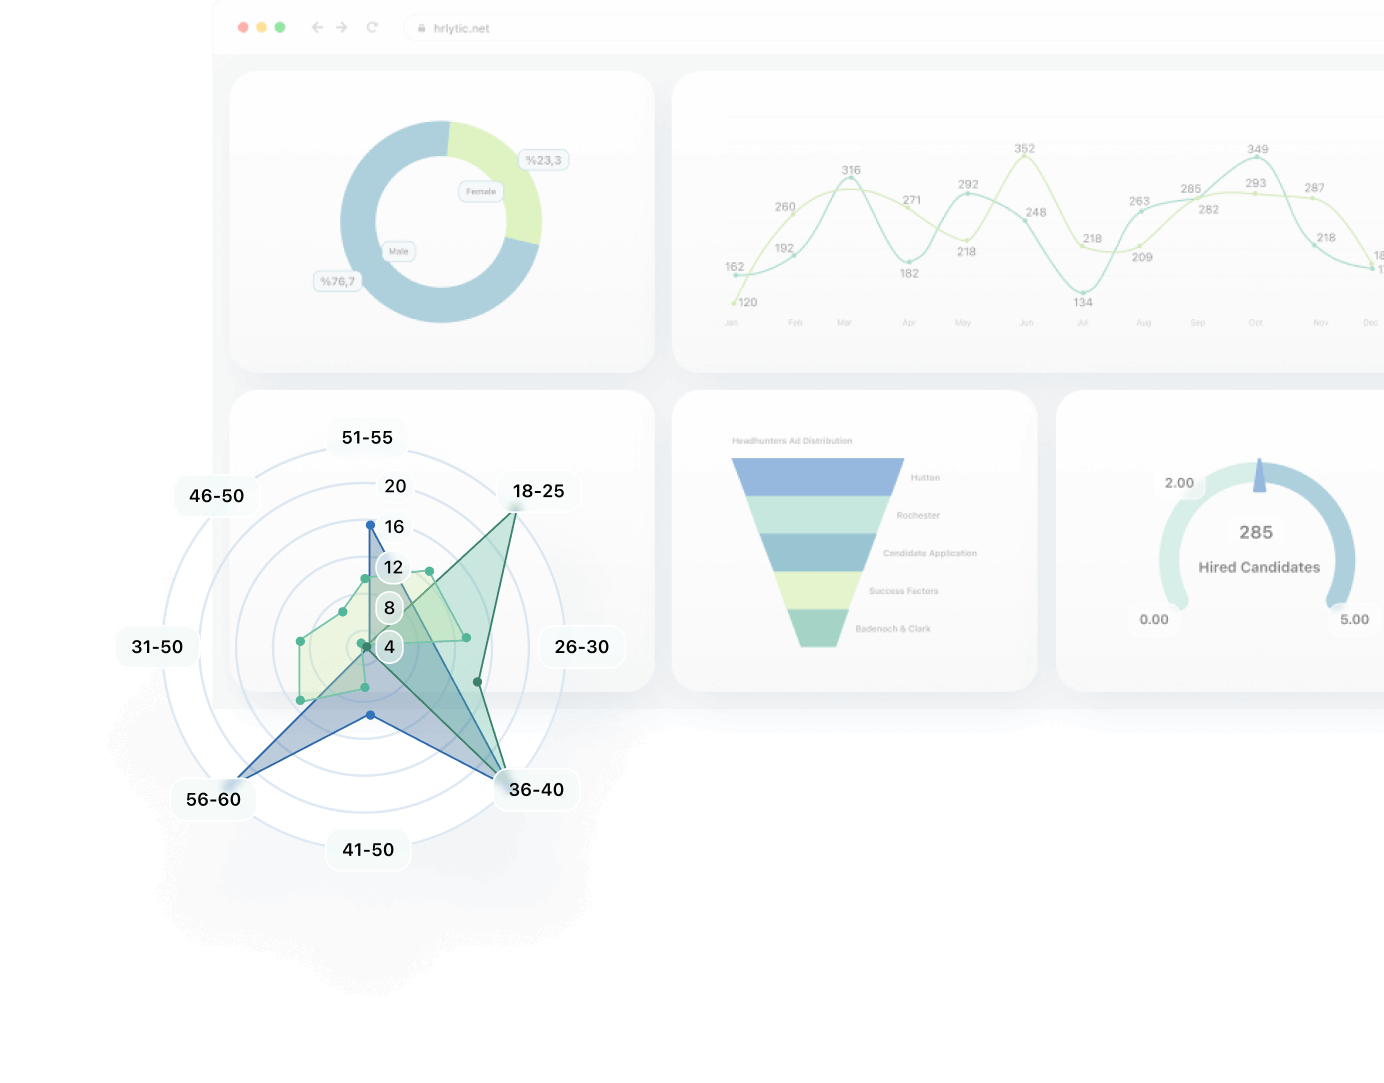
Empower HR excellence with new-gen smart HR Analytics!
Gain insights into your workforce, and make better decisions about your people.

With the prompt 250 + HR KPI sets, and define HR metrics to calculate your KPI’s automatically.
Get a 360-degree view of your employees with our comprehensive employee analytics platform.
Plan for your future workforce needs with our corporate workforce planning tools.
Forecast your HR needs and identify potential risks with our predictive analytics.
Easily design your HR analytic structure with prompt HR data models within HRLYTIC.
Analyze your HR report sets with different perspectives either employee & FTE based. You make top-down analysis on dashboards and graphs.
Design your top management reports to analyze your company’s productivity and profitability with different correlations based on different HR related KPI’s.
Make detailed analysis about the performance of your processes and plan your future actions about these processes with AI based HR forecasts.
Get the insights you need, when you need them, with our flexible reporting tools.
Define different user authorization levels to define the report sets and dashboards that the end users can reach.
Easily prepare your presentations with visual human resource reports and dashboards with drag and drops.
The design of the data visualization and reports can be specific to the needs of your company.
With the prompt 250 + HR KPI sets, you can calculate your KPI’s automatically.
HRLytic enables analysis of all your HR functions 360°, build up the reporting structure specific to the needs of your company.
Make analysis of your operational processes more effective and develop strategies to improve the operational workload.
Make your predictions today about the future with AI based forecasting analysis on your data.
You can easily design your HR analytic structure with prompt HR data models within HRLytic.
Analyze your report sets with different perspectives either employee & FTE based. You make top-down analysis on dashboards and graphs.
Design your top management reports to analyze your company’s productivity and profitability with different correlations based on different HR related KPI’s.
Make detailed analysis about the performance of your processes and plan your future actions about these processes with AI based forecasts.
Provides report designs specific to your company’s needs, while enabling the end users to get information from the reports based on their specific focus areas.
You can define different user authorization levels to define the report sets and dashboards that the end users can reach.
You can easily prepare your presentations with visual reports and dashboards with drag and drops.
The design of the data visualization and reports can be specific to the needs of your company.
With the prompt 250 + HR KPI sets, you can calculate your KPI’s automatically.
HRLytic enables analysis of all your HR functions 360°, build up the reporting structure specific to the needs of your company.
Make analysis of your operational processes more effective and develop strategies to improve the operational workload.
Make your predictions today about the future with AI based forecasting analysis on your data.
You can easily design your HR analytic structure with prompt HR data models within HRLytic.
Analyze your report sets with different perspectives either employee & FTE based. You make top-down analysis on dashboards and graphs.
Design your top management reports to analyze your company’s productivity and profitability with different correlations based on different HR related KPI’s.
Make detailed analysis about the performance of your processes and plan your future actions about these processes with AI based forecasts.
You can define different user authorization levels to define the report sets and dashboards that the end users can reach.
Provides report designs specific to your company’s needs, while enabling the end users to get information from the reports based on their specific focus areas.
You can easily prepare your presentations with visual reports and dashboards with drag and drops.
The design of the data visualization and reports can be specific to the needs of your company.